
LESSON 15: MORE ABOUT GROWTH CURVES
In the lessons preceding, we have seen that the industrial growth of
Western Europe and North America has, within the last 150 years, undergone a phase of development totally unlike that of any previous period in the world’s history. Industrial growth, we have seen, has followed the now familiar S-shape curve, beginning with the period of most rapid growth, and gradually reaching maturity and leveling-off.
We have seen further that it was by no means accidental that this spectacular industrial growth should have occurred in Western Europe and North America rather than in Asia or South America, for the simple reason that large scale industrial growth requires that there be readily available a suitable ensemble of mineral resources, principally coal and iron, together with the accessory minerals yielding copper, lead, zinc, and the ferro-alloys. This required assemblage of mineral resources in amounts essential to large-scale industrial growth has thus far only been discovered in the countries bordering the North Atlantic Ocean, and, according to present available evidence, is lacking in such amounts in other parts of the earth.
A large class of phenomena grows according to this same S-shape growth curve—bacteria, yeast, biological populations of all kinds, including human beings, as well as all kinds of industry. The ‘Decline’ Curve
The ‘Decline’ Curve. There is another type of ‘growth’ curve, however, that behaves in a manner quite differently from these that we have discussed thus far. This is a type which decreases as those above increase. Perhaps this latter should more correctly be called a ‘decline’ curve instead of a ‘growth’ curve. We can speak of them as growth curves, however, provided we understand the word growth to mean a change of magnitude, whether smaller or larger.
As an example of this latter type of growth phenomenon, consider the amount of human time required to produce a single thing, for instance, to mine a ton of coal. This brings us face to face with the problem of how we shall measure the amount of human time required to do a particular thing. One of the measures of human time commonly employed is that of the ‘man-day.’ A man-day would represent one man working one day. Thus, five men working 3 days each would be employed for 15 man-days.
The Man-hour. The objection to the man-day as a unit of human employment rests upon the fact that different man-days are not ordinarily of the same length. There have been times, both in this country and in England, when men worked 16 hours per day. At that time, a man-day would have been one man working sixteen hours. At the present time a man-day consists ordinarily of one man working 8 hours. Thus, a man-day with a man working 8 hours is only one-half as long as when the man works 16 hours.
It is this inconstancy of the man-day that makes it unsuitable as a measure of human employment. In order to accurately measure anything, one requires a unit of measurement which remains essentially the same. A far more suitable unit of measurement of human employment, therefore, is the man-hour.
A man-hour of human employment represents one man working one hour.
Now consider how many man-hours of human employment it must have taken, say 100 years ago, to mine a ton of coal. By considering the methods of coal mining then in use, we can arrive at some estimate of what this must have been. At that time practically all the coal mining in the United States was done entirely by hand methods—the digging with pick and shovel, and the hoisting with a rope and pulley or windlass. Coal mining was in its infancy, and only the most shallow seams were worked. If it had been possible by these methods to have worked the deeper seams such as are now worked with power machinery in the Pennsylvania anthracite fields, as well as the bituminous fields of the Middle West, the number of man-hours required per ton would have been enormously greater.
The best available data indicate that 100 years ago, one man could not mine on the average more than a ton of coal in one day of 12 hours; in other words, it took 12 man-hours to mine one ton.
In the industrial growth that followed, the coal mining industry, as we have already seen, increased enormously until by 1918 we produced 670 million tons of coal in one year. During all this period, slowly at first, and then more rapidly as the production grew in size, we improved our coal mining technique. First, steam pumps and power hoists were introduced; then blowing engines for the ventilation of the mines; explosives were used for breaking the coal and rendering more easy its extraction. Later, coal cutting machines and automatic loaders were introduced. More recently, large scale strip mining methods have been employed where giant electric shovels of 30 and 40 tons per bucketful strip off the overlying rock to depths of 50 or 60 feet. These are followed by smaller shovels which scoop up the coal seam thus uncovered and dump it directly into waiting railroad cars.
Figured on the basis of coal mined, the average rate of production of all the coal mined in the United States is approximately six tons per man per eight-hour day. Stated in terms of man-hours, this means that it now takes 8 man-hours on the average to mine 6 tons of coal, whereas, 100 years ago it required 12 man-hours to mine one ton of coal. Thus, the man-hours required per ton of coal mined has declined since 1830 from 12 to 1.33 man-hours per ton of coal.
If we had considered only the best modern practice, such as is represented in completely mechanized underground mines, or in the strip mines, a much greater drop would have been found. The strip mines average about 15 tons per man per eight hours. This represents approximately one-half man-hour per ton.
If complete data were available to plot a graph of the number of man-hours required to mine 1 ton of coal from the year 1830 to the present, one would find that the number, instead of getting larger with time, grows continuously smaller. In order to reduce the number of man-hours required to mine 1 ton of coal below the figures that have been reached already, it is not even necessary to invent any new machinery. One needs only to install modern labor-saving equipment in those mines which have not been so equipped; and by so doing, it will be possible to reduce the number of man-hours required to mine a ton of coal much below the figure that we now have reached.
In order to obtain an idea of the rate at which this mechanization of the coal mines is taking place, it is interesting to note that in the year 1923, 1,880,000 tons of bituminous coal were produced by mechanized mines; by 1931, the bituminous coal produced by mechanized mining had reached 47,562,000 tons, a growth of 25 fold in 8 years. This latter figure represents somewhat less than 10 percent of the total coal mined, so that there remains still to be mechanized approximately 90 percent of our bituminous coal mines. The process of mechanization in this field is continuing almost unabated right through the present depression. This will result in a continuous decline of the man hours required to mine 1 ton of coal.
A trend similar to that in coal mining has been taking place in every industrial field. The number of man-hours required to produce a bushel of wheat, a pair of shoes, a yard of cloth, a ton of iron, or to transport a ton-mile of freight, was greater 100 years ago than it has been any time since. A curve plotted in any one of these fields would show that the man-hours required to produce one unit of product has been, and still are, getting fewer.
Mechanization of Industry. Technocracy has previously called attention to some of the more spectacular instances of mechanization of industry, such as the A. O. Smith Company’s plant in Milwaukee which produced, while running, 10,000 automobile chassis frames per day with a crew of 208 men, and similar instances. While it is true that industry as a whole has not attained the level reached in its own best practices, the trend in every field is in that direction. Every time a new plant is built, or a new piece of equipment designed that replaces older equipment which has become obsolete, this new equipment runs faster and requires fewer man-hours of human attention per unit of production than its predecessor.
Another example of such a decline curve which has already been mentioned briefly in a previous lesson is that of the size of the equipment required for a given rate of production. The faster equipment is made to operate, the smaller it will be in proportion to its output. A similar relation holds good in office floor space. With the old-fashioned method of having bookkeepers work over hand-written ledgers, a much greater amount of office floor space was required to keep the books of a given volume of business than is now required with modern high-speed bookkeeping machinery.
That this process is going on unabated is shown by computations made from the Federal Reserve Board indices of production and employment in the manufacturing industries. Computation from these indices based on some 69,000 industrial establishments show that the productivity per man-hour during the period from 1920 until June 1933, almost exactly doubled. One-half of this increase occurred since 1930. In other words, mechanization proceeds more rapidly during depressions than otherwise.
On the whole, mechanization of industry in this country, far from being near completion, has just begun. We are now in the transition from the period characterized by the hand-operated machine into that characterized by the almost completely automatic technological mechanism. Instances such as the A. O. Smith plant and the Owens bottle machine are but forerunners of the general industrial development of the near future.
Decline of Man-Hours. Figure 7 represents schematically these two types of growth curve over the same time period but plotted to different scales vertically. The curve of production used here is essentially that of the growth of total energy. The declining curve is a composite curve based upon such fragmentary data as are available. The man-hours per unit in the early stages declined but slowly, and then more and more rapidly as industry expanded and became more mechanized.
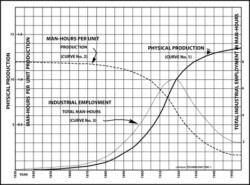
Figure 7
A third curve is also shown which is derived by computation from the first two. It is a matter of simple arithmetic to compute the number of man-hours required to produce a given number of units if we know the number of man-hours required to produce one unit. Thus, the total man-hours of employment in productive industry for any given time is equal to the product of the number of units produced in that time, multiplied by the average number of man-hours required to produce one unit.
Curve III was obtained by multiplying at successive times the production by the man-hours per unit. Assuming that Curves I and II are a correct picture, then Curve III would represent the industrial employment for this period stated in total man-hours.
In the early stages of industrial growth, the man-hours per unit were decreasing but slowly, consequently the employment grew at approximately the same rate as the industrial production. Then during the period of most rapid industrial growth, the increased use of labor-saving machinery with the consequent decline in the number of man-hours per unit produced tended to retard the rate of growth of industrial employment. During this period, new jobs were still being created due to the expansion of industry, faster than the old ones were being eliminated due to its mechanization. Finally, as industrial production began to level off with no corresponding slackening in the increase of mechanization, there came a time when jobs were eliminated by labor-saving machinery faster than they were created by expansion of old, or the creation of new industries.
This peak of employment has occurred at different times in different individual industries. In agriculture, the peak of employment as shown by the United States census, taken at intervals of ten years, was reached in 1910 with over 12,000,000 gainfully employed workers; by 1930 this number had declined to less than 10,500,000 persons.
The peak of employment in mining industries was reached in 1920. In the production of pig-iron the peak of employment, according to the United States Labor Bureau statistics, occurred in 1919. In the production of automobiles, the peak occurred in 1923. According to the Federal Reserve Board, the peak of industrial employment for all industries in the United States was about January 1920.
Much has been said by the apologists for the present system about new industries creating new jobs. Only recently, President Karl T. Compton, of Massachusetts Institute of Technology, and Professor R. A. Millikan, President of California Institute of Technology, broadcasted speeches by radio which have since been published in the Scientific Monthly on the thesis that science creates employment.
The essential burden of these gentleman’s remarks consisted in such arguments as: The automobile industry employed more men than the wagon industry had previously been able to do. Therefore, new industries always will employ more men than the industries which they displace. Only a casual inspection of Figure 7 would demonstrate the utter fallacy of any such careless type of reasoning. The automobile industry grew up during the period of most rapid industrial expansion when jobs were being created faster than they were being eliminated. The peak of automobile production was not reached until 1929, but that of automobile employment occurred in 1923. If production continues to level off no matter how slowly, and if the man-hour-per-unit production curve continues headed downhill, it follows that the total industrial employment stated in man-hours, which reached its peak about 1920, must continue to decline.
It is to be emphasized that these three curves as illustrated in Figure 7 are all long-time trends, and do not include the effect of this or any previous period of depression. Note that there are no cycles in these curves. They have never repeated themselves, and there is never any going back.
Every new industry creates new jobs and eliminates old ones. Whether the number of man-hours per year of new jobs created by the composite of all new industries and expansion of old ones is greater or less than the number of manhours per year of the old jobs eliminated depends entirely upon what stage in the growth of total industry is being considered. At all times prior to the occurrence of the peak in the curve of total man-hours per year the birth rate of new jobs exceeds the death rate of old ones and the hours of employment continuously increase. At all times subsequent to the occurrence of that peak (neglecting minor oscillations) the death rate of old jobs exceeds the birth rate of new ones and the man-hours of employment continuous decrease. Since, for American industry, this peak occurred about the year 1920, it is fallacious to employ events prior to that date as a basis upon which to draw conclusions which are supposed to be valid after that date. For the period of American industrial growth prior to 1920 it is entirely correct to state that the creation of new industries and the expansion of old ones increased the annual hours of employment; for the period subsequent to that date, it is entirely incorrect to make the same statement.
It might be remarked in passing that total man-hours in industrial employment does not necessarily bear any relation to unemployment. If a total number of man-hours are required annually in industry, and if a total number of human beings are available as industrial workers, it is only necessary to properly adjust the length of the working day in order to accommodate any number of available workers. The trends depicted in Figure 7 point inexorably to an ever increasing unemployment or else to an indefinite shortening of the length of the working day.
References:
- Statistical Abstract of the U.S.
- Monthly Labor Review, U.S. of Labor.
- Bulletins, U.S. of Labor.
- Bulletins, Federal Reserve Board.
- Technological Trends and National Policy, National Resources Committee.